Small Cap Strategy
Our Results So Far
As of January 31, 2019. Please note all returns are net of fees and expenses. Past performance does not indicate future performance.
RETURNS SINCE INCEPTION (CAD) AND PERFORMANCE SUMMARY*
As of January 31, 2019. Based on a representative managed account. Returns are gross returns, as net returns vary by benchmark selected.
Investment Strategy
Investment Philosophy
We employ what we describe as an “Enterprising Approach”. We believe that there are multiple mental frameworks that, over time, can produce attractive absolute returns. Our process is to apply the appropriate framework demanded by the circumstance to maximize the return on a given investment idea. Dogmatic adherence to a single mental framework is not a value maximizing strategy. Instead, we restrict ourselves to investing in businesses that we can understand and where we can clearly formulate a thesis for attractive returns.
How We Define Risk
We don’t believe that popular descriptive statistics such as volatility or beta, are good representations of investment risk. Instead, we describe risk as the possibility of not meeting our minimum acceptable return hurdle over time. In today’s interest rate environment, we consider equity returns in the low-teens as the “minimum acceptable” threshold. More generally, we aim to grow the purchasing power of capital under our management over time. Safety of principal is the fundamental component to achieving our return objectives.
Incentives
We believe that professional investment managers should be paid to add value and not gather assets. To that end, we have designed the incentives in our Long-Only Small Cap strategy to reinforce focus on performance. These incentives include an ETF-like management fee and a performance allocation reflective of the value we deliver relative to our partners’ opportunity cost.
Thoughts On Benchmarking
We leave the choice of the benchmark that represents the opportunity cost of our partners capital to our clients. Too often the benchmark used to evaluate managers’ performance becomes her/his number one source of investment ideas as she/he starts to view any deviation from the benchmark as a risk factor. Our approach is different, we believe that over the long-term, if we can find investment ideas that will compound capital in the teens, we will outperform any reasonable benchmark for a North American mandate. As our approach usually translates to sizable active share, our investors should understand that over any time-period the performance of the fund can substantially deviate from that of the broader markets.
Capacity Restrictions
As a demonstration of our commitment to the long-term success of our investment strategy, we have put in place explicit restrictions on the amount of capital that we will accept in our investment strategy.
Flexible Fixed Income Fund LP
Our Goal
The goal of the partnership is to earn 5-7% annualized net returns, over a reasonable timeframe, while controlling volatility and minimizing the risk of permanent loss. We define a reasonable timeframe as five years, which translates into a cumulative return in the range of 30-40%. We think our goal of achieving stable, 5-7% net returns compares favorably to our two principal benchmarks – the iShares Canadian Investment Grade Corporate Bond Index ETF and the iShares US High Yield Bond Index (C$-hedged) ETF. These two benchmarks reflect well-known and accessible fixed income alternatives which can be regarded as our Limited Partners’ fixed income opportunity cost.
Fund Performance
*Returns reflect Class P – Master Series **Hedged to CAD
MONTHLY NET RETURNS (%)*
As of January 31, 2019. Please note all returns are net of fees and expenses. Past performance does not indicate future performance.
Philosophy and Fund Management
Investment Philosophy
In the Flexible Fixed Income Fund, we believe that there are multiple mental frameworks that can produce attractive risk-adjusted returns. We have created an ‘Investment Playbook’ framework which articulates specific models of thinking used to evaluate fixed income investments. Our process is centered on evaluating individual investment opportunities using appropriate models of thinking demanded by the circumstance. Proper evaluation should enable us to identify investments that have low chance of permanent loss which also offer attractive absolute returns. Dogmatic adherence to a single mental framework is not a value maximizing strategy. Instead, we restrict ourselves to investing in businesses and capital structures that we can understand and where we can clearly formulate a thesis for attractive returns.
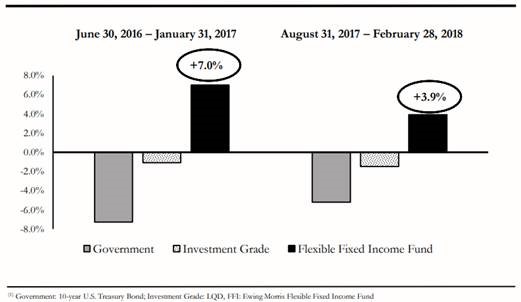
Managing Through Rising Interest Rates

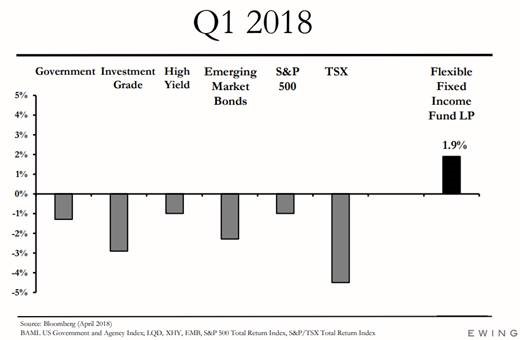
Managing Through Broader Market Turbulence

Thoughts On Risk
A critical part of our goal is to minimize the risk of permanent loss (what we consider to be true investment risk) and control volatility. We would posit that “permanent loss” also be considered “permanent loss of purchasing power,” a concept that takes into account the impact of inflation on capital. At current rates of inflation, one dollar today needs to grow by about 2% on an after-tax basis to avoid loss of purchasing power. From this perspective, it can be understood that long term allocations to cash effectively ensures permanent loss. Even at today’s low rates of inflation, a 5-year holding period would result in an approximate 10% impairment on cash relative to the future cost of living. Our view is that higher yielding fixed income investments are one of the few conservative means of minimizing loss of purchasing power while maintaining a liquid investment profile.
Partners' Fund
The Partners’ Fund gives our Limited Partners access to our full investment team and their expertise, across our strategies.
The Partners’ Fund allocates dynamically to each of our strategies with an average weighting of 60% Opportunities Fund, 10% Dark Horse and 30% Flexible Fixed Income Fund over time. The Fund may invest in other funds or underlying securities from time to time, that complement these strategies. We may adjust the allocation to each of the funds as market conditions change, and opportunities arise.
Investment Strategy
We describe our investment strategy using the analogy of a sport’s playbook. A team with only one play can often be stopped but a championship team will have perfected multiple plays so that they can score and defend regardless of the opposition’s strategy. In our Partners’ Fund, we classify each investment according to three plays:
Offensive Playbook
The Offensive Playbook involves investing in units of the Ewing Morris Opportunities Fund LP which applies a private equity mindset to public company investing. The Opportunities Fund LP employs a long-term investment orientation and invests in a concentrated portfolio focusing on inefficient areas of the public markets. The Fund is geared towards capital preservation and targets a net return to LPs of 10% per annum over time, with lower volatility than the broad-based North American equity markets.
Defensive Playbook
The Defensive Playbook is designed to preserve capital for investors through all market environments, particularly during periods of rising interest rates. This is achieved by investing into the Ewing Morris Flexible Fixed Income Fund LP, which has historically had lower volatility and low correlation with general markets and targets 5-7% net returns per annum over time.
Neutral Zone Playbook
The Neutral Zone Playbook is accessed via the Broadview Dark Horse LP, a low net exposure North American long-short fund focused on small cap companies. The strategy is capital structure agnostic and seeks “equity-like” returns. The investment approach is to look for structural, nuanced or temporal inefficiencies, conduct deep research and pursue company involvement as a back-up plan. Investment opportunities are reviewed through a private market value lens.
Risk Management
We view risk as the chance of permanent capital loss and believe that volatility represents a source of opportunity. We invest when security prices are trading at a significant discount to our estimate of true value. This is designed to provide a margin of safety to protect capital against unexpected events such as economic crises, natural disasters, political events and new technologies. Our goal is to protect and grow our clients’ purchasing power over time.