“Investment is most intelligent when it is most businesslike […]. Every corporate security may best be viewed, in the first instance, as an ownership interest in, or a claim against, a specific business enterprise.” – Benjamin Graham
Although most equity managers would likely nod in agreement, our guess is that the percentage of practitioners actually following this prescription is smaller today than at any other time since the publication of “The Intelligent Investor” in 1949.
Today, much of the investment-related academic work and professional curriculum is focused on applying relatively straightforward statistical tools to historical asset prices with very little time spent thinking about underlying businesses.
The rise of descriptive statistics in investment management can be traced back to a paper published in 1952, three years after the Intelligent Investor, by a graduate student at the University of Chicago, Harry Markowitz.
In his paper, Markowitz described risk as follows:
“The concepts “yield” and “risk” appear frequently in financial writings. Usually if the term “yield” were replaced by “expected yield” or “expected return,” and “risk” by “variance of return,” little change of apparent meaning would result.”[1]
Markowitz, who had limited interest in, or exposure to, businesses or stocks prior to publishing his paper, but was proficient in mathematics and in particular linear programming, prescribed that investors focus on expected returns and expected volatility of asset prices when constructing their portfolios. In practice, reliable estimates for expected returns and expected volatility for most assets are simply not available. Undeterred, proponents of modern portfolio theory have substituted expected returns and expected volatility with historical returns and historical volatility.
To illustrate why focusing on historic returns and volatility has led to an un-businesslike approach to investing, consider the following two types of questions:
A: What have Apple Corporation’s monthly common stock total returns been over the past five and ten years? What has been the standard deviation of these returns?
B: What do you expect Apple’s Corporation’s earning power to be over the next five to ten years? How wide is the range of your estimates?
The answer to the first question only requires access to readily available data and basic mathematics. The answer to the second question also needs data, but more importantly, it calls for judgement. The investor will need to understand Apple’s business economics, past and present, and form an opinion of how likely the company’s economics are to change in the future.
By focusing on descriptive statistics, one might become more informed about price, but it is only by answering the second type of question that we learn something about value. It is our belief that the best investment decisions are made when there is a clear distinction between the two.
This un-businesslike approach has certain practical implications:
Closet indexing. A manager worried about price volatility is unlikely to own concentrated positions (i.e. positions weighted 5%+), which often result in more volatile portfolio returns on any given day. Studies have shown that an average mutual fund manager in the U.S. owns approximately 90 securities and 20% of mutual fund managers own in excess of 228 securities.[2]
The propensity to hug the benchmark is reinforced by use of what we would consider misguided performance measures such as tracking error. Tracking error measures the volatility of the difference in returns between the manager and the benchmark. When the tracking error is substantial, the manager is said to have assumed “active risk”.
In practice, this means that if a manager buys a stock that is currently included in the benchmark, he will reduce “active risk” regardless of whether he knows anything about the business or its valuation.
In a way, Modern Portfolio Theory has transformed a benchmark designed to evaluate managers’ performance into managers’ leading source of investment ideas!
Trading returns for reduced volatility. For those who accept the notion that risk equals volatility, trading returns for a smoother ride might seem like an entirely sensible approach. For those of us who define risk as the possibility of not earning a minimum acceptable return over time, while preserving capital, this trade-off is dubious. To illustrate why we believe this to be the case, we present the graph below:
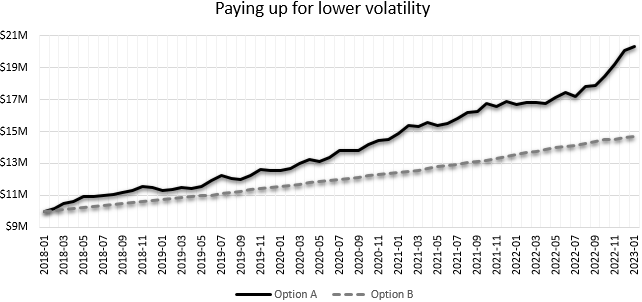
Option A is a simulated portfolio with 15% expected return and 15% expected standard deviation of returns.
Option B is a simulated portfolio with 8% expected return and 5% standard deviation.
In the absence of leverage or short-term capital commitments, we find Option B hard to justify. However, those subscribing to the “risk equals volatility” notion would likely take Option B over Option A.
[1] Markowitz, H. (1952) Portfolio Selection.
[2] Elton, E., Gruber, M. (2008) Security Concentration and Active Fund Management: Do Focused Funds Offer Superior Performance?